
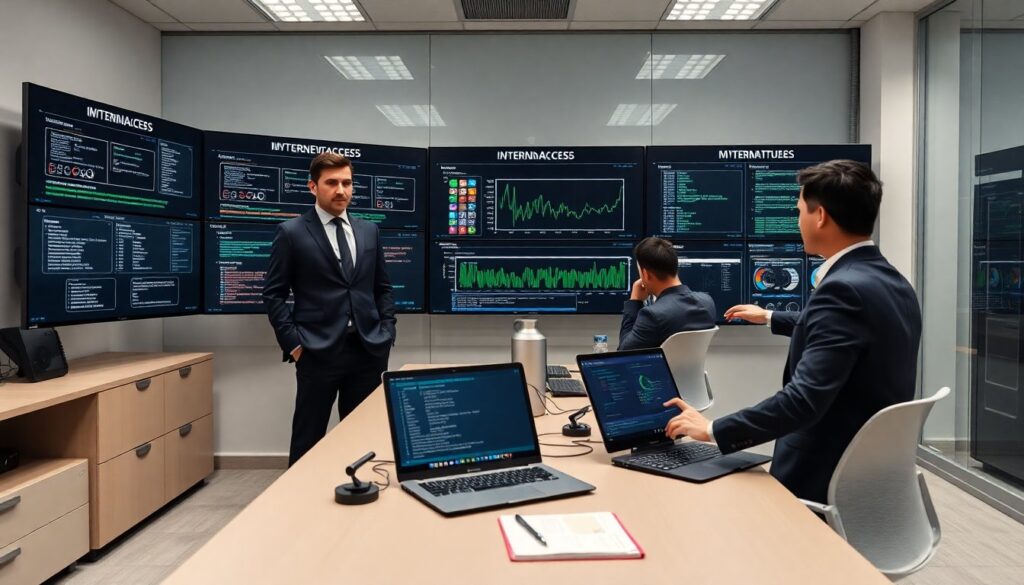
MyInternetAccess malware sandboxing helps analysts isolate threats quickly. The team uses virtualized environments to run samples safely. The platform records behavior and artifacts for analysis. Analysts tune environments to reduce false negatives and reveal stealthy code. This guide shows advanced techniques for MyInternetAccess malware sandboxing that improve detection and speed.
Key Takeaways
- MyInternetAccess malware sandboxing uses realistic virtual environments to coax malware into revealing its behavior effectively.
- Configuring system-level artifacts and simulating user actions enhances detection by mimicking real-world conditions closely.
- The sandbox detects evasive and anti-analysis techniques by monitoring environment checks and forcing hidden code execution paths.
- Dynamic instrumentation and memory forensics capture detailed malware activity, enabling precise API monitoring and forensic analysis.
- Automation and orchestration enable the MyInternetAccess malware sandboxing platform to scale efficiently and integrate seamlessly with threat response workflows.
- Continuous tuning of sandbox configurations reduces false negatives and improves detection speed, making MyInternetAccess malware sandboxing a critical tool for analysts.
Designing Realistic Sandboxed Environments
Analysts design realistic sandboxes to coax malware into revealing itself. They configure operating systems, install common user applications, and seed realistic files. The sandbox presents network services and typical folder structures. The team maps common host artifacts and places them in the virtual disk. They set time, locale, and screen resolutions that match target victims. They enable realistic process lists and background jobs to match production hosts. They script user actions such as file opening and document editing. The team records artifact creation and timestamps to compare with live incidents. They vary hardware signals, such as CPU and memory, to avoid detection by simple checks. They test multiple configuration profiles to increase coverage and to reduce blind spots.
System-Level Configuration, Artifacts, And User Simulation
The analyst configures kernel drivers, registry keys, and installed fonts. They add browser histories and email caches that match a normal user. They populate user folders with documents, photos, and spreadsheets. The sandbox runs common background apps such as printers, cloud sync clients, and messaging apps. The team simulates user input by moving the mouse and opening files at timed intervals. They inject realistic timestamps into files and logs. They enable shadow copies and restore points to show persistence behavior. They snapshot the system state before and after execution for quick rollback. They use multiple snapshots to observe delayed routines without rebooting the host.
Detecting Evasive And Anti-Analysis Behavior
The sandbox monitors signs of anti-analysis to flag stealthy samples. It watches for environment checks, delays, and conditional payloads. The platform checks for virtualization artifacts, debugger presence, and sandbox fingerprints. The analyst records unusual timing patterns and sparse network activity. They compare observed behavior with baseline execution to find anomalies. When the sample hides actions, the team forces code paths with controlled inputs. They replay network responses to simulate real servers and to trigger hidden modules. The system logs failed checks and marks them for deeper study. The team keeps a catalog of anti-analysis techniques and countermeasures for faster triage.
Dynamic Instrumentation, Memory Forensics, And API Monitoring
The analyst attaches dynamic tracers to observe live execution. They capture function calls and stack traces to map behavior. The sandbox dumps process memory at intervals for offline forensics. They carve out decrypted payloads and configuration blobs from memory. The monitoring hooks record API calls to network, file, and registry functions. The team correlates API sequences with indicators of compromise to build detection rules. They use selective code patching to bypass anti-debug checks and to force payload activation. They log memory changes and map them to code paths. They share memory artifacts with analysts for static and behavioral correlation.
Operationalizing, Scaling, And Integrating With Threat Workflows
Security teams automate sandbox runs to handle high sample volume. They queue samples from email gateways, endpoints, and honeypots into MyInternetAccess malware sandboxing. The platform tags and prioritizes samples by risk and by observed behavior. Engineers add orchestration to distribute runs across worker nodes. They monitor queue length and resource use to avoid backlogs. They integrate sandbox outputs with ticketing, SIEMs, and malware repositories. Analysts generate detection signatures and IOC lists automatically from sandbox reports. The team tunes the automation to reduce false positives and to increase useful outputs. They apply feedback loops so detections update routing, enrichment, and response playbooks. The deployment uses containerization and orchestration to scale quickly while preserving environment fidelity.